
Active Memory
There still seems to be some confusion over what the Active Memory statistic of a virtual machine within vSphere. See example below.
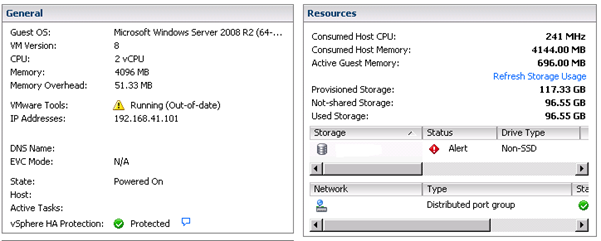
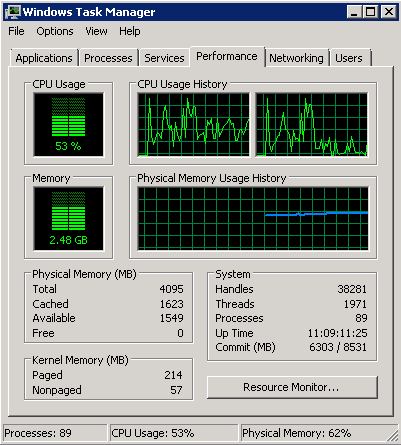
You can see that this virtual machine is configured with 4096 MB of memory and the Active Guest Memory is being reported as 696 MB. So what is this Active Guest Memory? If I look within the operating system of this virtual machine I can see that at this point in time it is using 2.48 GB of memory, see below.
VMware define Active Memory as “Amount of memory that is actively used, as estimated by VMkernel based on recently touched memory pages”. The overhead of monitoring every memory page access would be too much for the hypervisor so a random sampling is used to estimate the active memory. So, how often is “recently”? This depends on where you are looking at the statistic, in vCenter it is refreshed every 20 seconds so it is showing the amount of memory that has been touched in the last 20 seconds.
If we look at the memory charts in vCenter for this virtual machine we can see that the active memory is fairly static at between 750 MB and 1,000 MB.
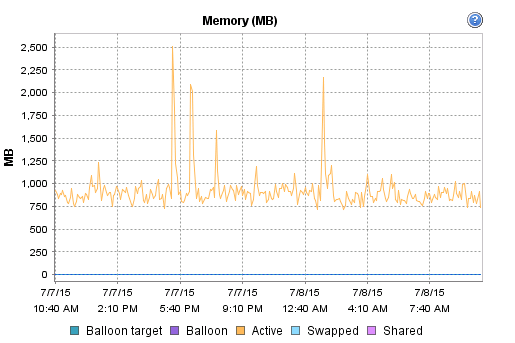
You could assume from this that the virtual machine is only using about 1 GB of memory; however we saw the operating system reporting that about 2.5 GB was being used. What we don’t know from the information in the graph is if for each sampling period it was the same memory pages that were touched. It could be that in one 20 second period 750 MB of memory was accessed and in the next 20 seconds a different 750 MB of memory was accessed. For this reason this statistic is not a good value to take to right-size the virtual machine.
Consumed Memory
What I notice for Windows Servers is that the Consumed Host Memory is always almost equivalent to the amount of memory configured on a virtual machine. Taking the example above where the virtual machine is configured for 4096 MB of memory the consumed memory is being reported as 4144 MB. This is higher than the configured memory as it also includes the memory overhead used by the hypervisor to run the virtual machine. My understand of why Windows Server report that they are consuming all of the memory they are allocated for, even though we can see from the operating system in this case that it is only using 2.5 GB is because when the server boots up it zeros out all of the memory pages and therefore the hypervisor needs to present these memory pages to the virtual machine.
Pingback: Newsletter: July 11, 2015 | Notes from MWhite